Table of impedance maxima comparison for the Impedance of Short Cone (theory vs. experimental)
| Maxima frequency [Hz] (Ratio fn/f1) | Interval [cents] | Maxima magnitudes | Ratio [db]
|
|---|
| Theoretical | Experimental | Theoretical | Experimental
|
|---|
| 295.42 (1.000) | 298.16 (1.000) | 16.02 | 22.26 | 20.84 | -0.57
|
| 670.06 (2.268) | 677.38 (2.272) | 18.81 | 21.67 | 17.65 | -1.78
|
| 1073.24 (3.633) | 1062.24 (3.563) | -17.84 | 15.48 | 14.60 | -0.51
|
| 1485.29 (5.028) | 1479.06 (4.961) | -7.28 | 11.13 | 9.52 | -1.35
|
| 1901.20 (6.436) | 1887.92 (6.332) | -12.13 | 8.34 | 7.11 | -1.39
|
Plot in PNG format
Table of impedance maxima comparison for the Impedance of Alto Saxophone Neck (theory vs. experimental)
| Maxima frequency [Hz] (Ratio fn/f1) | Interval [cents] | Maxima magnitudes | Ratio [db]
|
|---|
| Theoretical | Experimental | Theoretical | Experimental
|
|---|
| 547.90 (1.000) | 552.13 (1.000) | 13.30 | 36.33 | 33.04 | -0.82
|
| 1321.70 (2.412) | 1292.42 (2.341) | -38.78 | 23.25 | 19.68 | -1.45
|
| 2152.14 (3.928) | 2116.36 (3.833) | -29.03 | 13.82 | 10.12 | -2.70
|
| 3001.44 (5.478) | 2936.46 (5.318) | -37.89 | 9.16 | 7.36 | -1.90
|
| 3860.45 (7.046) | 3802.26 (6.887) | -26.29 | 6.56 | 5.20 | -2.03
|
Plot in PNG format
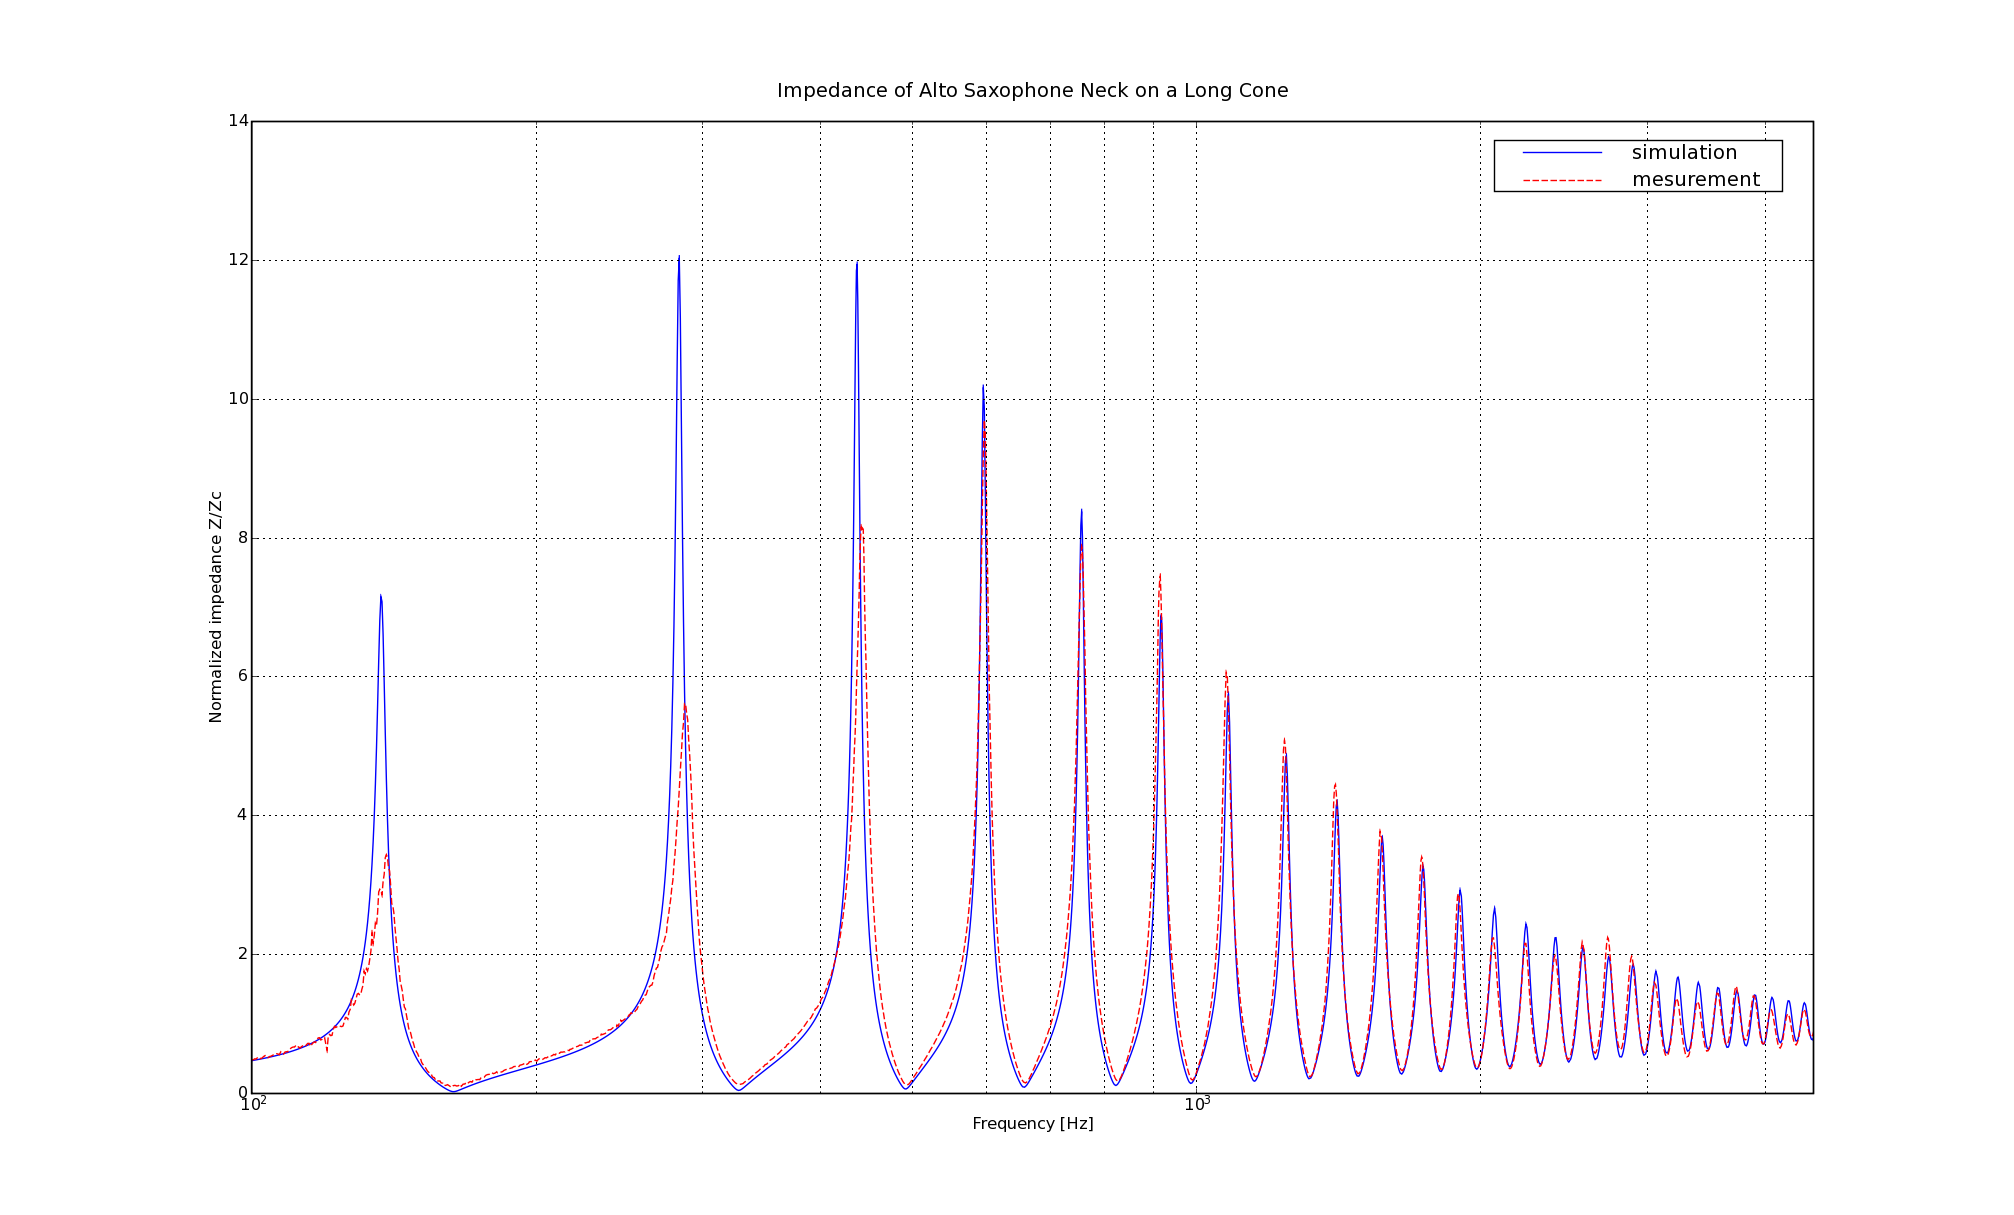
Table of impedance maxima comparison for the Impedance of Alto Saxophone Neck on a Long Cone (theory vs. experimental)
| Maxima frequency [Hz] (Ratio fn/f1) | Interval [cents] | Maxima magnitudes | Ratio [db]
|
|---|
| Theoretical | Experimental | Theoretical | Experimental
|
|---|
| 137.09 (1.000) | 138.81 (1.000) | 21.66 | 7.18 | 3.44 | -6.39
|
| 283.28 (2.066) | 287.46 (2.071) | 25.40 | 12.07 | 5.65 | -6.60
|
| 437.00 (3.188) | 441.82 (3.183) | 19.02 | 11.99 | 8.17 | -3.33
|
| 595.10 (4.341) | 596.48 (4.297) | 4.02 | 10.21 | 9.71 | -0.43
|
| 755.65 (5.512) | 756.06 (5.447) | 0.94 | 8.39 | 7.88 | -0.54
|
Plot in PNG format