Next: How is a spectrum obtained? Up: Signal Spectra Previous: Signal Spectra
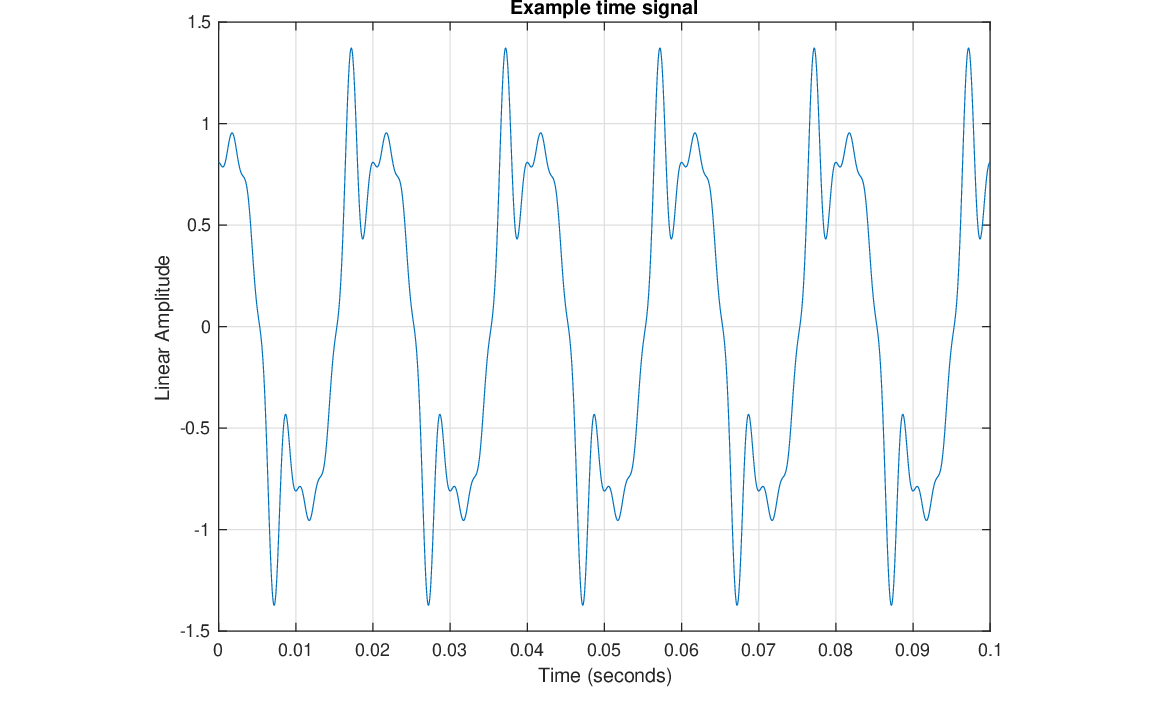
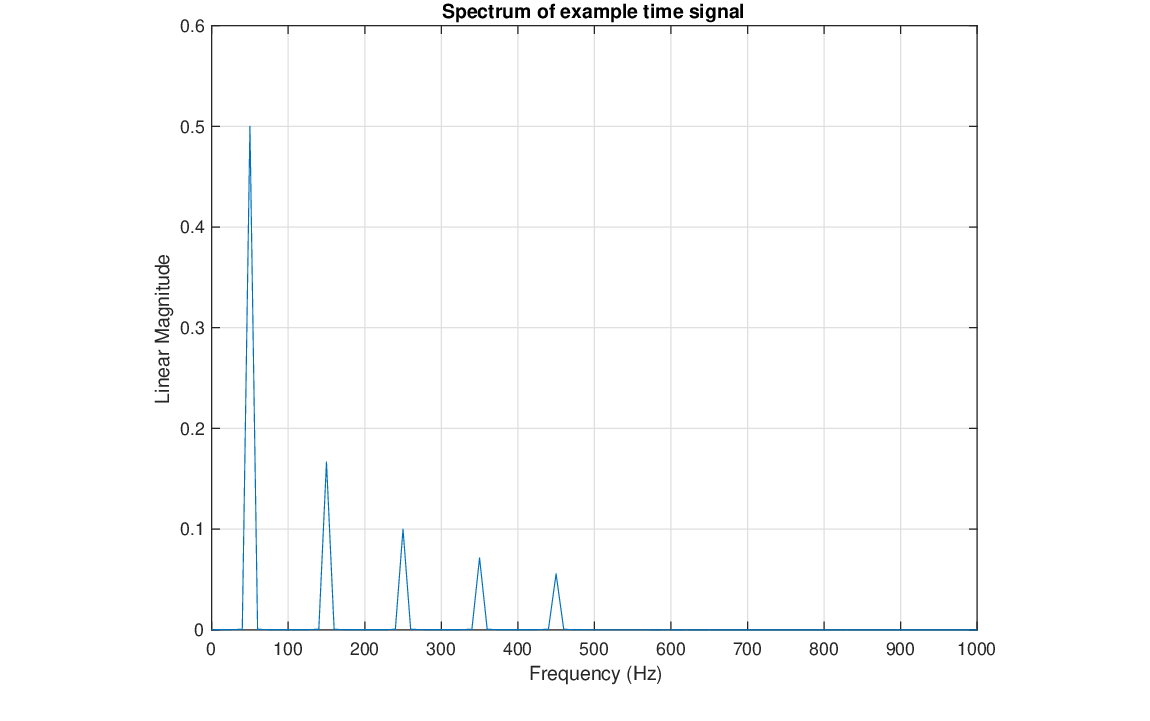
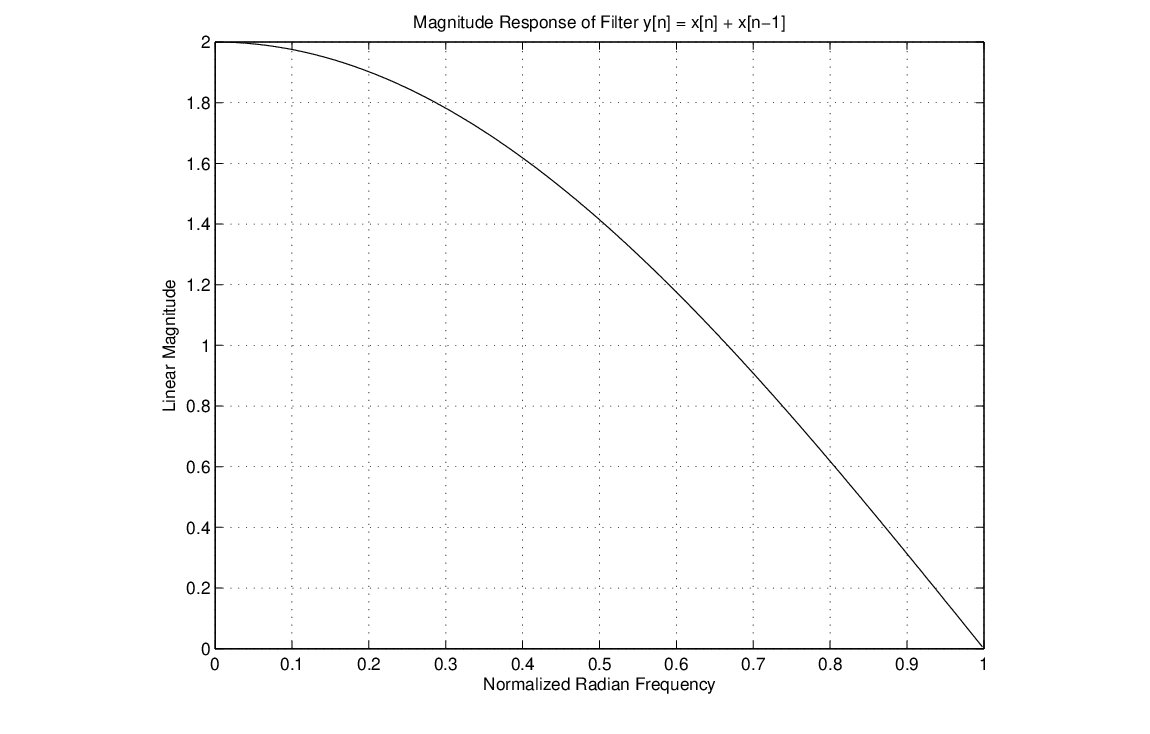
![$y[n] = x[n] + x[n-1]$](img1.png) . It is certainly possible to gain intuition on the behavior of this filter by considering its output given various input signals in time. However, a relatively easy sequence of steps allows us to realize the filter response for all sinusoidal frequency inputs from
. It is certainly possible to gain intuition on the behavior of this filter by considering its output given various input signals in time. However, a relatively easy sequence of steps allows us to realize the filter response for all sinusoidal frequency inputs from  as plotted below (where
  is the digital sampling rate).

| ©2004-2024 McGill University. All Rights Reserved. Maintained by Gary P. Scavone. |