Next: Ring Modulation Up: Amplitude Modulation Previous: Amplitude Modulation
 and the modulating oscillator frequency is specified by
  .
.
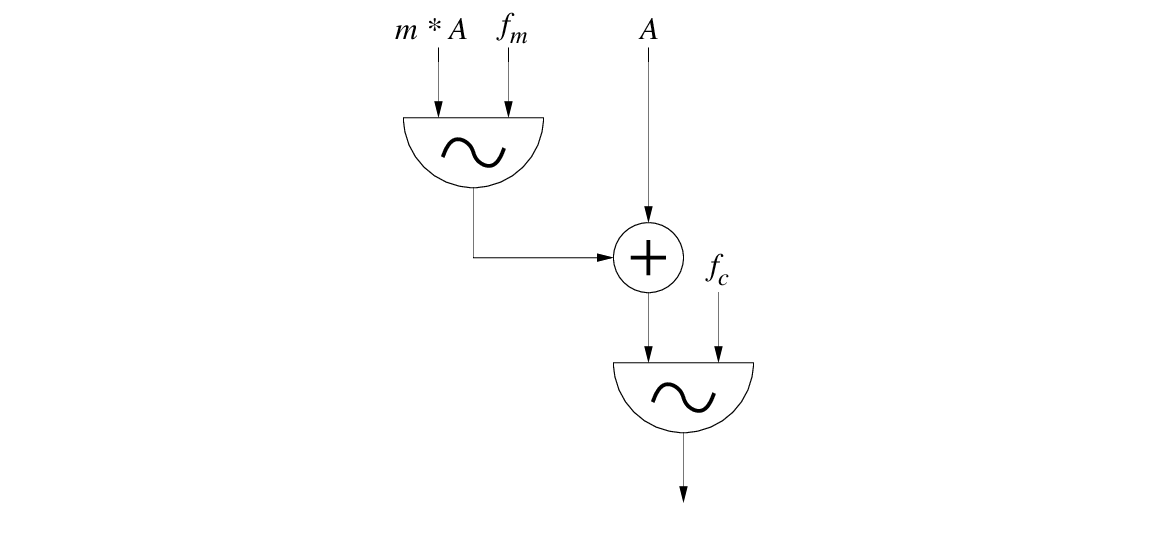
 , is used to control the modulating oscillator amplitude in proportion to the unmodulated carrier oscillator amplitude
  .
.
 , no modulation takes place. When
  , the amplitude of the modulating oscillator is equal to the unmodulated carrier amplitude, which represents 100% modulation.
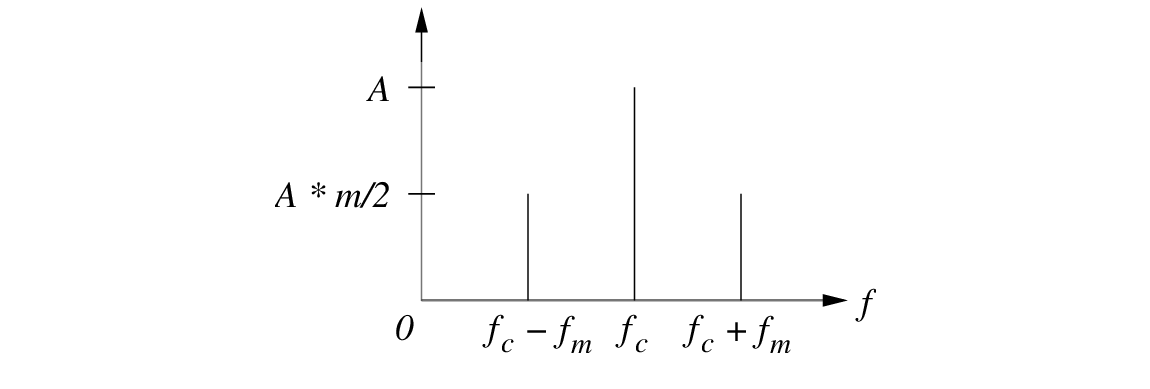
 ) contains three frequencies as shown in Fig. 2: the carrier frequency () and two sidebands at
  .
.
 , but does not affect the carrier frequency amplitude.
):
less than about 10 Hz, the amplitude envelope variations are clearly heard.
 10 Hz but small enough that the sidebands fall within the same critical band, the loudness of the resulting sound is proportional to the average amplitude of the modulating waveform.
that exceeds one-half the critical bandwidth, the sidebands are perceived individually.
10 Hz but small enough that the sidebands fall within the same critical band, the loudness of the resulting sound is proportional to the average amplitude of the modulating waveform.
that exceeds one-half the critical bandwidth, the sidebands are perceived individually.

| ©2004-2024 McGill University. All Rights Reserved. Maintained by Gary P. Scavone. |