Next: Historical Aspects of FM in Up: Frequency Modulation (FM) Synthesis Previous: Vibrato Simulation
 and its amplitude is
  .
.
 and amplitude
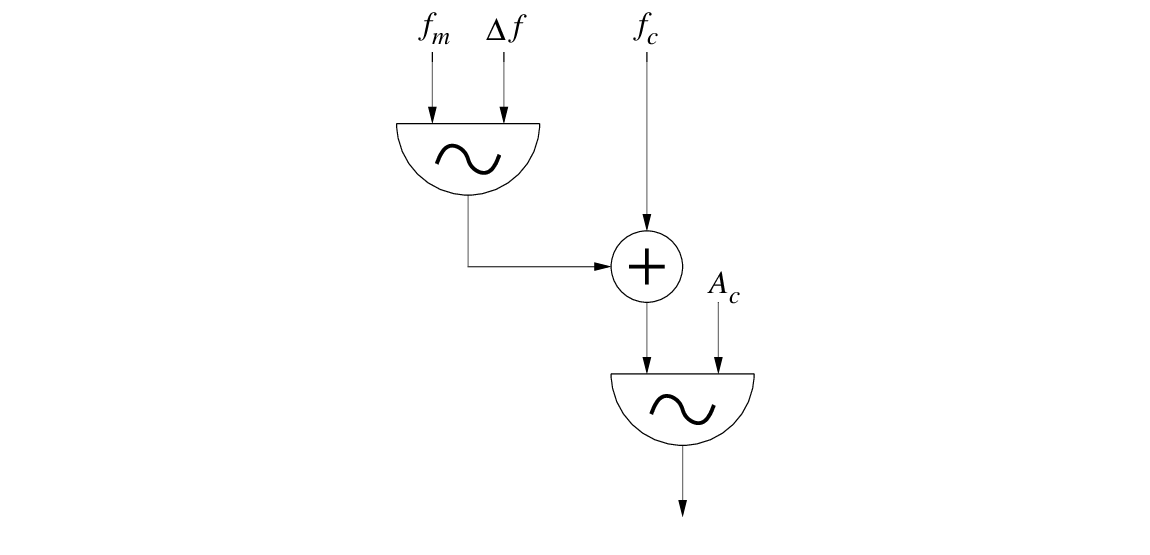
  . Note that controls the peak frequency deviation.
 , no modulation takes place. As increases, the deviation of the carrier frequency () increases.
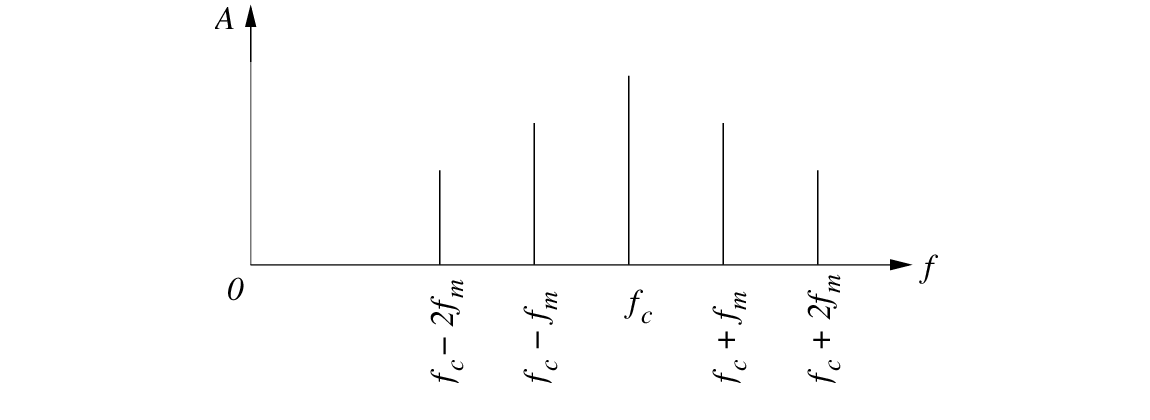
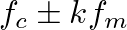 , where
  is an integer, as sketched in Fig.10.
(in the absence of fold-over).
increases the energy in the sidebands at the expense of energy at the carrier frequency.

| ©2004-2024 McGill University. All Rights Reserved. Maintained by Gary P. Scavone. |