Next: Tapped Delay Lines Up: Delay Lines Previous: Delay Line Interpolation: Linear Interpolation
![\begin{eqnarray*}
\hat{x}[n-\Delta] \ensuremath{\stackrel{\Delta}{=}}y[n] &=& a ...
...[n-1] - a \cdot y[n-1] \\
&=& a \cdot (x[n] - y[n-1]) + x[n-1].
\end{eqnarray*}](img101.png)
 , the delay becomes
 , the allpass coefficient
  is determined as
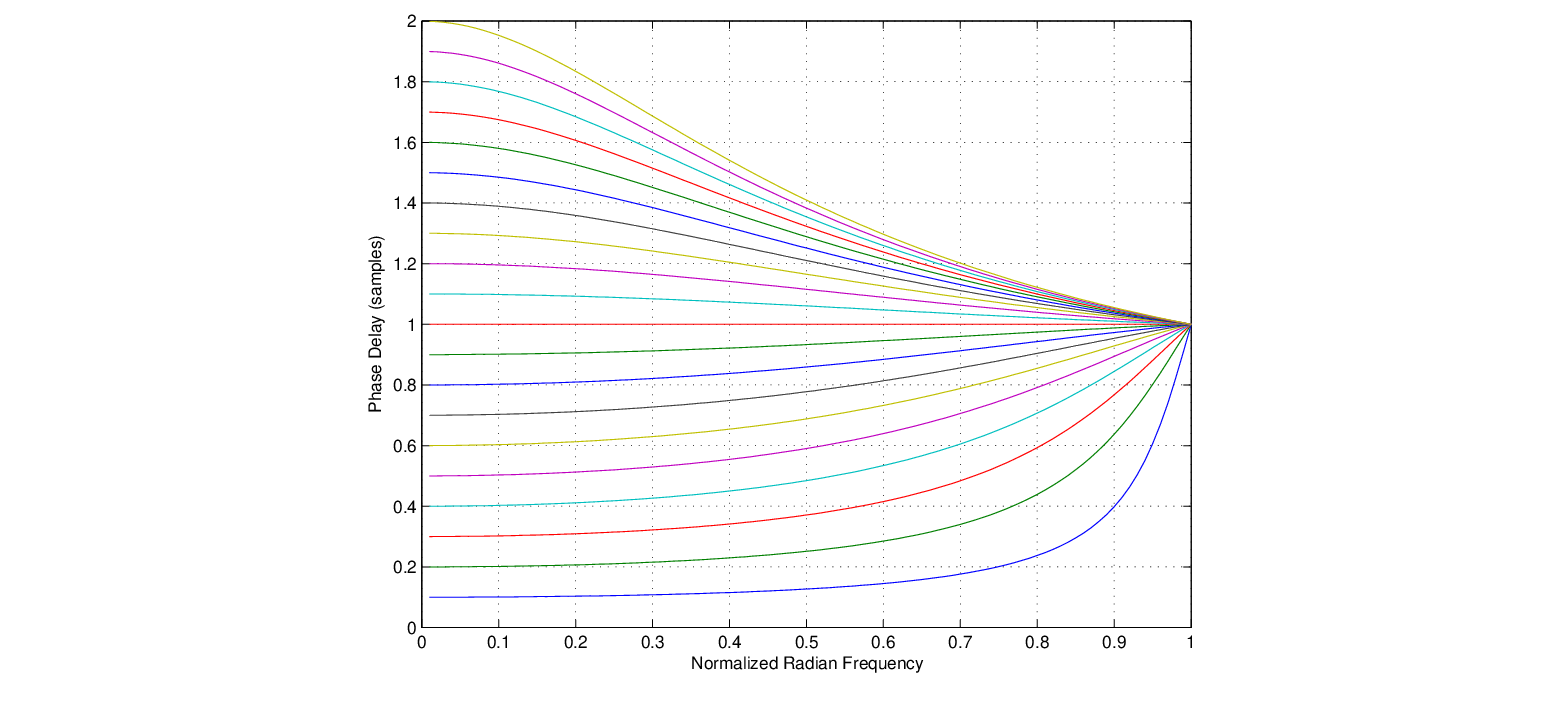
 is best maintained in the range
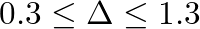 to achieve maximally flat phase delay response together with the fastest decaying impulse response, a desired characteristic when dealing with dynamic delay values and their associated transient responses.
closer to 0.0 have significantly longer transient “tails”.
 |

| ©2004-2024 McGill University. All Rights Reserved. Maintained by Gary P. Scavone. |
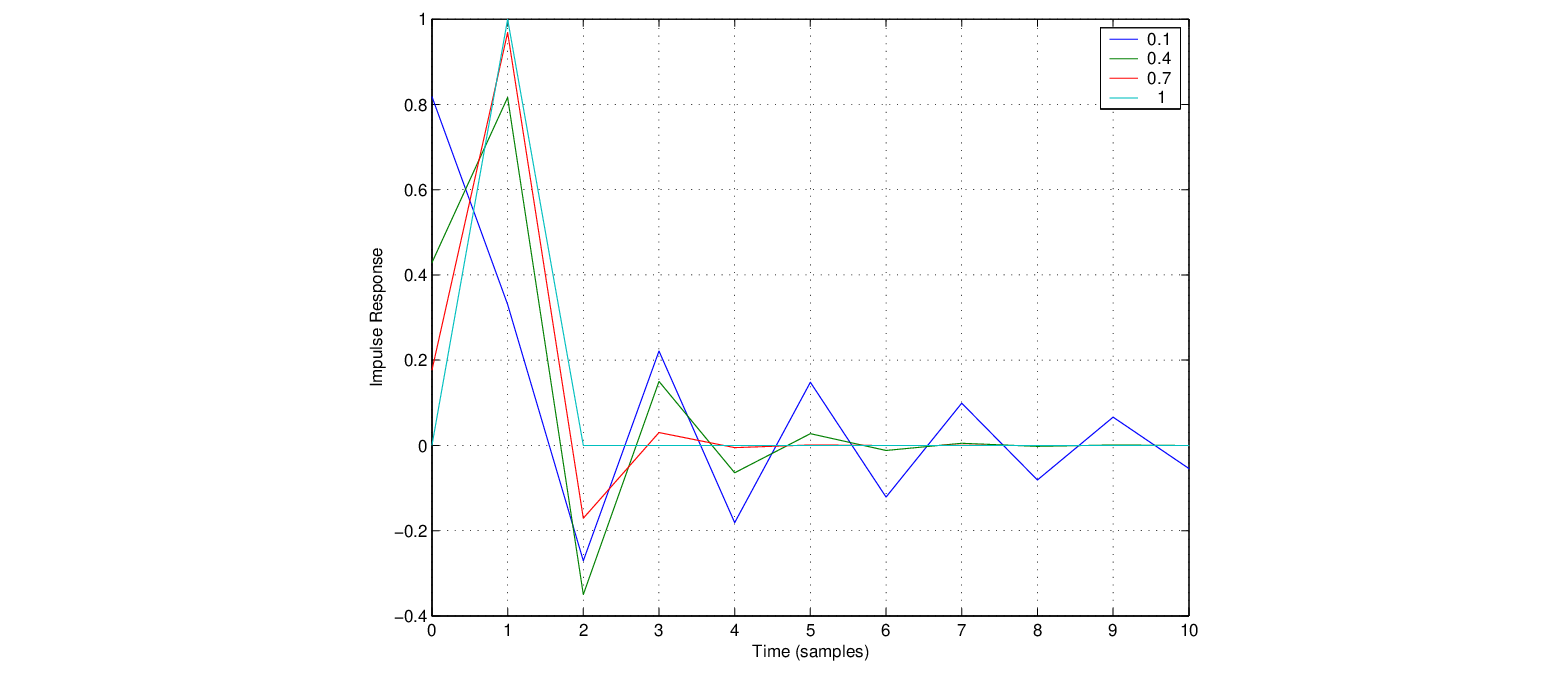
![\begin{figure}\begin{center}
\begin{picture}(3.9,1.2)
\put (0.27,0){\epsfig{fi...
... \put (3.8,0.56){$\hat{y}[n-M-\Delta]$}
\end{picture} \end{center}
\end{figure}](img102.png)